Skip to content
Search for:
Standards for Insulating links
ANSI/CPLSO-14
ANSI/UL2737 (Withdrawn)
ASTM F2973
MIL-L-24410 (Withdrawn)
Tests by Independent Organizations
Load Insulator
Miller & Hirtzer
Search for:
Download
Download Page
Download Right Page
1
2-3
4-5
6-7
8
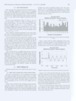
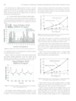
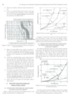
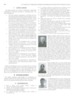
G. G. Karady eta&: Performance Evaluation of Insulating Links Used for Worker Protection in Cranes The steady-state rms. leakage current of Link A was also arcing or non-linear conductivity on the surface. Visual obser- measured, when the dry link voltage was increased approxi- vation also indicated short arcs on the link surface. However, mately lkV/s to 50 kV, the maximum current was 0.63 mA. the extremely limited visibility in the fog chamber prevented These tests proved that the dry pollution does not affect the the recording of this arcing. performance of insulating links. 3.2 CLEAN FOG TEST OF POLLUTED LINKS 3 400 E - Figure 6 shows typical results of peak and rms leakage cur- ESDD=0.018 rnglcrn2 300 rents measurements of Insulating Link A when clean fog wet- ted the heavily polluted link and it was energized 25 times at 20 kV. Heavy Pollution; 20 kV 1 1~11~~ESDD=0.133mglcm2 r- - Test Voltage (kV) Figure 8. Peak leakage current of Insulating Link A, Light pollution ESDD = 0.018 mg/cm2; Heavy pollution ESDD = 0.133 mg/cm2. Both links were tested in a similar way using heavy and lighl pollution at different voltages. The results of each test series are similar to that was presented in Figures 6 and 7. The safew of the crane worker de~ends on the current flow- Number of Energization Figure 6. Leakage current waveform of heavily polluted Insulating Link A. .-. The maximum current was determined by statistical analysis as explained earlier in section 3.1 Figure 7 shows the waveform of the typical transient leak- age current. Sudden application of the test voltage, drives transient current though the wet surface. The peak value of this transient current is important from safety point of view. Heavy Pollution; 20 kV ESDD=0.133 mglcm2 Time (s) Figure 7. Waveform of leakage current of heavily polluted, wet Insulating Link A, when energized to 20 kV. The transient current attenuates rapidly. Typically, a more or less constant current flows through the link after 3-6 cycles. In Figure 7, the non-sinusoidal periodic waveform indicates ing through the link. To assess the links that provides protec- tion in case of sudden voltage application the measured peak and rms. current vs. voltage were plotted at heavy and light pollutions. Figure 8 shows the peak leakage current vs, yoltage at light and heavy pollution for Insulating Link A. The dots on the figures represent the measurement points. -1 - 10 15 20 25 30 35 40 Test Voltage (kV) - Figure 9. RMS leakage current of Insulating Link A, Light pollution ESDD = 0.018 mglcm'; Heavy pollution ESDD = 0.133 mg/cm2. Figure 9 shows the rms value of leakage current vs. voltage at light and heavy pollution for Insulating Link A. Link A was tested using 10 kV, 20 kV, 26.6 kV, 30 kV and 40 kV. Figure 10 shows the peak and rms leakage current vs. test voltage of Insulating Link B at heavy pollution. This link was tested using 20kV, 25 kV and 30kV. Link B has significantly longer creepage distance than Link A, which explains the rela- tively low current at rated voltage of 25 kV. At light pollution
Page load link
Go to Top