Skip to content
Search for:
Standards for Insulating links
ANSI/CPLSO-14
ANSI/UL2737 (Withdrawn)
ASTM F2973
MIL-L-24410 (Withdrawn)
Tests by Independent Organizations
Load Insulator
Miller & Hirtzer
Search for:
Download
Download Page
Download Right Page
1
2-3
4-5
6-7
8
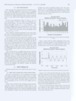
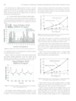
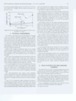
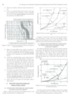
ZEEE Transactions on Dielectrics and Electrical Insulation VoL 15, No. 2; April 2008 2.2 TEST PROCEDURE First, each link was polluted and dried as described in sec- tion 2.1, thereafter subjected to a dry test or to a modified clean fog test comprising of 25 repeated voltage applications. In general, each link was tested at 10 kV, 20 kV, 25 kV, 30 kV and 40 kV voltage levels and at light and heavy pollution levels. In some cases, not all voltage or pollution levels were used. All tests were performed in ASUs' W 3.6m x L 3m x H 2.5m fog chamber. A 40 kVA, lOOkV test transformer sup- plies the fog chamber. The short circuit current of the trans- former and supply system is Isc = 5.2A at 100 kV. The maximum leakage current (Ihm) during the tests was 330rnA. According to IEEE Std 4-1995 the ratio of Isd I,, max should be > 1 1. Actual value of the short circuit and leakage current , ratio was Isd Ih, = 15.75. Three ultrasonic nebulisers generated the fog using deion- ised water. Combined fog generation rate of the 3 units were 9 l/h. Typical fog droplet diameter was around 1 micron. First, the polluted links were tested in dry condition. For the dry test, the link was installed in the fog chamber but the fog was not applied. The test voltage was applied to the link 25 times for 5-10 seconds duration each time. 40kV test voltage was used for Link A and 25 kV for Link B, because its rated voltage is 25 kV. Digital oscilloscope recorded the current flowin through the link using a resistive shunt. Because of the lo& 5 eakage current values, no test was performed at lower voltage levels. This was followed by a modified clean fog test, when fog gradually wetted the polluted link. Leakage current measure- ment using 2 kV ac voltages monitored the wetting process. Using the voltage and current values the surface resistance was calculated. When the surface resistance was at a mini- mum, the insulating link was energized repeatedly to the test voltage 25 times for 5-10 seconds. At each voltage application the peak value and rms value of leakage current was recorded. The test was repeated with different voltages and different contamination levels. 3 TEST RESULTS Polluted insulating links were tested in dry and wet condi- tions. 3.1 DRY TEST OF HEAVILY POLLUTED LINKS The test was performed in room temperature and around 30% relative humidity. The rated voltage of Link A is 50kV, but preliminary clean fog tests indicated that the polluted link flashed over above 40 kV. The rated voltage of Link B is 25 kV. Consequently, 40 kV or 25 kV test voltages were se- lected. Figure 4 shows the peak value of leakage current of Insulat- ing Link A when it was energized 25 times at 40 kV. The leakage current was measured using a resistive shunt. The data were statistically analyzed; the average and standard deviation were calculated. Average value plus three times the standard deviation was used as maximum current. This value corre- sponds to 99.7 % probability if the distribution is Gaussian [13]. In this case the predicted peak transient leakage current was 2.66 mA. The value obtained this way is more than the actually measured 2.16 mA. Dry test; 40 kV ESDD=0.25 mglcm2; Heavy Pollution Rabs (PEAK) rnA , ._ -_ % 2.5 7--- Number of Energization Fipure 4. Peak and m. leakage current of heavily polluted, dry Insulating Link A. . Figure 5 shows that the sudden energization drives short duration oscillating capacitive current through the link. The duration of this oscillation is less than half cycle. This is fol- lowed by more or less constant capacitive 60 Hz current. Dry test; 40 kV ESDD=0.25 mglcm2; Heavy Pouution -% I 0.02 0.04 0.06 0.08 0.1 Time (sec) Figure 5. Leakage current waveform of heavily polluted Insulating Link A. Figures 4 and 5 show that both peak and rms value of leak- age current depends on the time of voltage application. Ran- dom energization of the link simulates the conditions that may occur when a crane contacts a transmission line. The 25-time repeated voltage application assures that the maximum current is measured. The observed near- Gaussian distribution of the peak current justifies calculation of maximum current as aver- age plus three times standard deviation [13]. The test of Link B produced similar results, when the link was energized to rated voltage of 25kV. These tests showed that in both cases, the sudden energization generated capaci- tive current is less than 3 mA.
Page load link
Go to Top